
To Check Usage Statistics in Plesk, Monitoring usage statistics in Plesk is crucial for managing your server resources effectively. Plesk provides a comprehensive interface that allows you to track disk space, bandwidth, and other important metrics across your domains. Regularly checking these statistics helps ensure that your websites operate smoothly, prevents unexpected downtime, and optimizes resource allocation. Whether you’re a system administrator or a website owner, understanding how to access and interpret these statistics is key to maintaining optimal performance and planning for future growth. In this guide, we’ll walk you through the steps to access and review usage statistics in Plesk, enabling you to stay informed and in control of your server’s resources.

Follow these steps:
Log in to Plesk:
Access your Plesk control panel by logging in with your username and password.

Go to “Statistics”:
In the left-hand sidebar, click on “Statistics”.
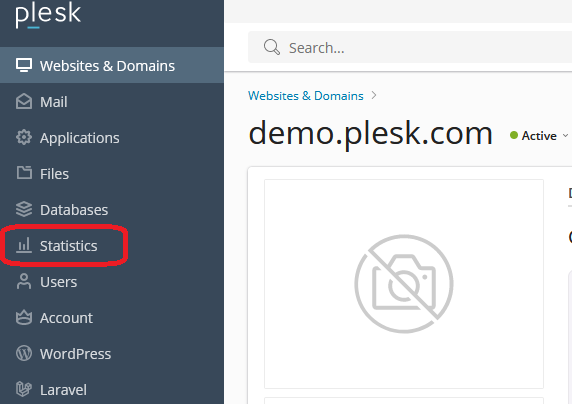
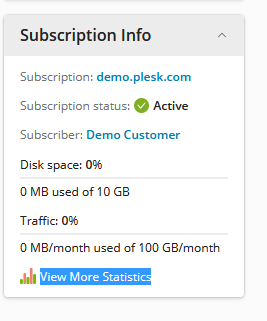
Alternatively, you can click on “Websites & Domains” and then on the domain name you want to check. After that, find and click on “View More Statistics” in the domain’s dashboard.
Check Usage Statistics in Plesk
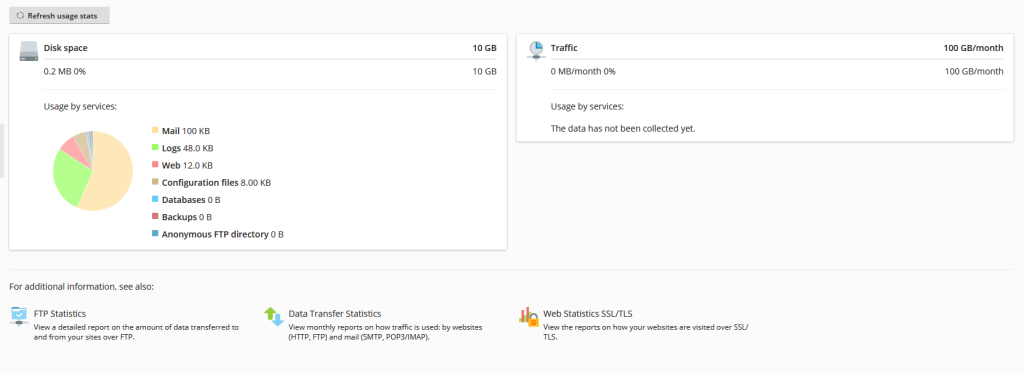
The “Statistics” page will display an overview of various usage metrics, including disk space and bandwidth.You will see a summary of the disk space used by different components (e.g., web files, databases, mail) and the bandwidth usage.
Detailed Usage Information:
Check Usage Statistics in Plesk For more detailed information, you can click on specific sections such as “Disk space” or “Traffic”.
This will give you a breakdown of usage by each component or service.
Custom Date Range:
If you want to Check Usage Statistics in Plesk for a specific time period, look for options to set a custom date range.
You can often find this option at the top of the statistics page or within specific sections.
Example Screenshots (if available)
- Disk Space Usage: Displays the total disk space usage and breakdown by web files, databases, mail, logs, etc.
- Traffic Usage: Shows the bandwidth used over a specified period, with a breakdown of HTTP, FTP, and mail traffic.
Additional Reporting Options
- Advanced Reports: Some Plesk installations have advanced reporting features that provide more detailed analytics. Check if your Plesk version supports this.
- Extensions: You can also install extensions for more comprehensive monitoring and reporting tools if needed.
By following these steps, you should be able to effectively monitor and manage your resource usage in Plesk.


